Blog
Showing posts with label Mapping. Show all posts

Thursday, 29 March 2007

Amaznode - ActionScript 3.0 for Amazon
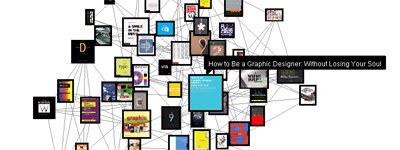

This is amazing. Not only does the initial homepage go back to the roots of great search engines (ie a just text box and simple options) but the scripting and linking between results is great. It was described by adobe as:

“A relation-based search engine for Amazon.com that is made with Flash and ActionScript 3.0. Visualize a relation network of products from the data of "customers who bought this item also bought" by digging related products again and again. Amaznode is not only for searching but also good for researching and making an associate link.”

Is it the future of online shopping? Maybe not or, if it is, then a suitable method of finding one specific item without loads of options appearing should be sought. What it is, however, is a really nice visual method of viewing relationships between products. It’s like Thinkmap Visual Thesaurus for the online retail world.

Visit the site here: amaznode.fladdict.net/ or check out Takayuki Fukatsu (designer and developer of Amaznode) and discover some of his great flash experiments.

Let me know if anyone has any other examples of really nice ActionScript3.0 stuff.

0 comments:

Tuesday, 20 March 2007

Breathing Earth - global CO2 tracker


I first came across a video of this on Max Kieslers site and thought it was quite fascinating. I'm not sure how accurate it is but it's interesting to watch the amount of CO2 rocketing up in the left hand corner. Whilst watching it the USA emitted 1000 tonnes of CO2 every 5.4 seconds! It is also quite interesting to see the relationship between births and deaths. In a time period of 5 minutes while I had it running in the background there appeared to be nearly three times the amount of births than there were deaths.

http://www.breathingearth.net/

0 comments:

Monday, 26 February 2007

Real Time Data Rendering

There seems to have been a flurry of activity in this area over the last 6 months or so and a few of the best examples are listed below - 3 of which come from the Digg Team (in partnership with Stamen Design). Although these methods might not be the clearest way to navigate information there is a definite need for fresh ideas in this area. As the web continues to grow and the amount of information available to us expands we need some method of filtering out what we don't need or, in the case of the Digg examples, a way of seeing information as it becomes available and being able to scan for stories of interest.

3D Real Time Blog Post Rendering
I was sent this link from a colleague, Chris (tempinbox.com), which shows actual blog post activity mapped onto a 3d world. Not sure how useful this would be but it is a really nice visual effect.


Digg BigSpy
News stories being dugg are placed at the top of the screen. Larger stories have more diggs.

DiggStack
DiggStack is amazing. As well as using colour coding and size to represent amount of Diggs the actual users who have digged a story fall from above and land on it to 'Stack' it up. The name of the stroy also appears below.

DiggSwarm
A circle is drawn as new stories are dugg. Diggers swarm around titles and make them grow. Related stories are woven together using lines and it is possible to distinguish between popular and unpopular stories with size and colour.

0 comments: